
XYCLE INCLUDED IN VERDANTIX SMART INNOVATORS 2025

a close up of a bed with white sheets and pillows
A delicate white peony flower against an orange background
a close up of a bed with white sheets and pillows
A delicate white peony flower against an orange background

Guide

Decarbonisation Strategy for Energy Transition Makers

Decarbonisation Strategy for Energy Transition Makers

Decarbonisation strategy for energy transition companies with practical examples and workflows.

Decarbonisation strategy for energy transition companies with practical examples and workflows.

Decarbonisation strategy for energy transition companies with practical examples and workflows.

Robert Pell

Robert Pell

IN SUMMARY

Key takeaways

Key takeaways

Energy transition manufacturers need carbon reduction pathways grounded in traceable product-level evidence. This guide explains how LCA identifies supply-chain hotspots, how XYCLE compares reduction scenarios, and how an auditable baseline supports targets, delivery plans and compliance reporting.

Energy transition manufacturers need carbon reduction pathways grounded in traceable product-level evidence. This guide explains how LCA identifies supply-chain hotspots, how XYCLE compares reduction scenarios, and how an auditable baseline supports targets, delivery plans and compliance reporting.

Energy transition manufacturers need carbon reduction pathways grounded in traceable product-level evidence. This guide explains how LCA identifies supply-chain hotspots, how XYCLE compares reduction scenarios, and how an auditable baseline supports targets, delivery plans and compliance reporting.

  • Energy transition manufacturers carry most of their emissions in materials and processing, so a generic corporate roadmap misses the biggest levers.

  • Energy transition manufacturers carry most of their emissions in materials and processing, so a generic corporate roadmap misses the biggest levers.

  • Energy transition manufacturers carry most of their emissions in materials and processing, so a generic corporate roadmap misses the biggest levers.

  • A decarbonisation strategy is only as strong as the evidence under it. Auditors, customers and regulators will ask where each number came from.

  • A decarbonisation strategy is only as strong as the evidence under it. Auditors, customers and regulators will ask where each number came from.

  • A decarbonisation strategy is only as strong as the evidence under it. Auditors, customers and regulators will ask where each number came from.

  • Start with a product-level life cycle assessment (LCA) to find the hotspots. Then set targets and test pathways against that baseline.

  • Start with a product-level life cycle assessment (LCA) to find the hotspots. Then set targets and test pathways against that baseline.

  • Start with a product-level life cycle assessment (LCA) to find the hotspots. Then set targets and test pathways against that baseline.

What are decarbonization strategy services?

Decarbonization strategy services help a manufacturer measure its emissions, set reduction targets and plan how to meet them. For energy transition makers, the strongest services build on life cycle assessment, so every pathway rests on traceable data rather than assumptions. Minviro combines LCA expertise with XYCLE software to deliver this.

The energy transition manufacturer’s paradox

Batteries, anode materials, magnets and renewable hardware exist to cut emissions. Yet making them is carbon-intensive, and much of that footprint sits upstream in mining, refining and chemical processing.

A roadmap built only on company-level figures can’t see that. It tells you the total but not the cause, and without the cause you can’t decide where to act first. That’s why manufacturing decarbonization starts with a clear picture of where emissions sit across the supply chain.

Why roadmaps without evidence fail scrutiny

Customers, investors and regulators increasingly want to see how a reduction claim was reached. A pathway built on industry averages is hard to defend when someone asks for the source.

Auditable carbon reduction services work the other way round. They record the data behind each input, show whether it was measured, calculated or estimated, and keep that trail intact as the plan evolves. If the evidence is thin, you know before anyone else does.
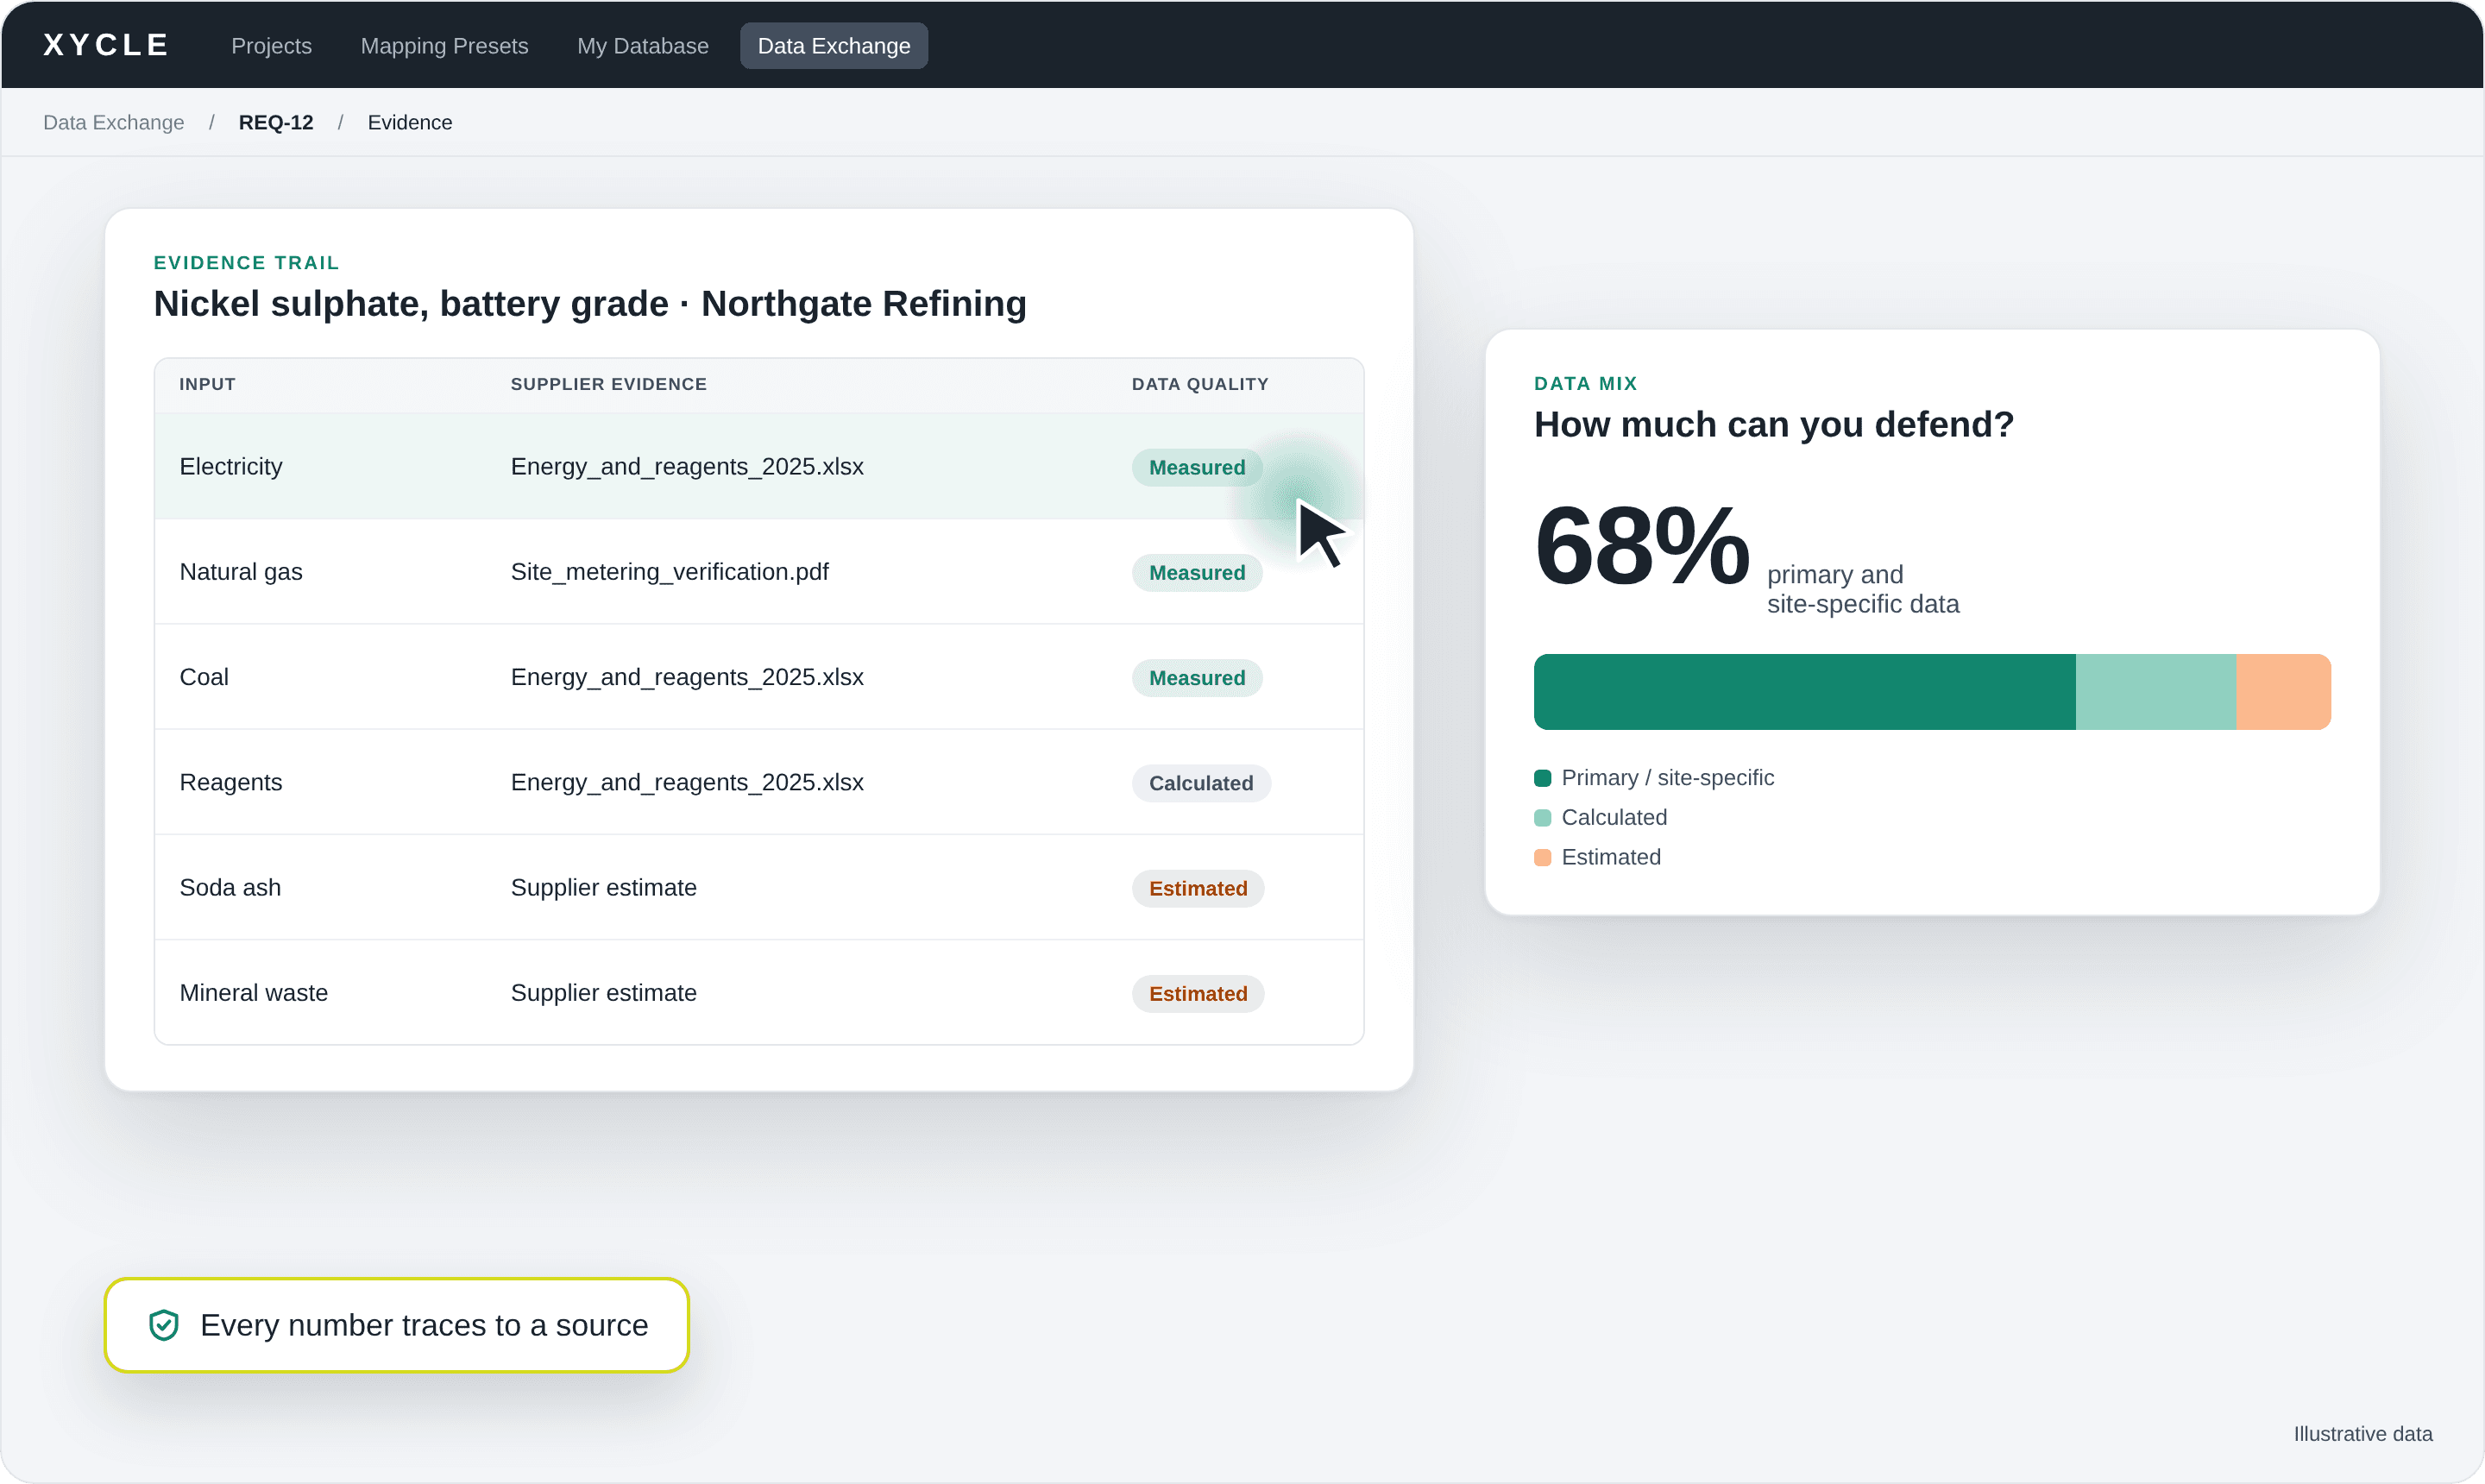
XYCLE decarbonisation evidence trail

Decarbonization strategy services help a manufacturer measure its emissions, set reduction targets and plan how to meet them. For energy transition makers, the strongest services build on life cycle assessment, so every pathway rests on traceable data rather than assumptions. Minviro combines LCA expertise with XYCLE software to deliver this.

The energy transition manufacturer’s paradox

Batteries, anode materials, magnets and renewable hardware exist to cut emissions. Yet making them is carbon-intensive, and much of that footprint sits upstream in mining, refining and chemical processing.

A roadmap built only on company-level figures can’t see that. It tells you the total but not the cause, and without the cause you can’t decide where to act first. That’s why manufacturing decarbonization starts with a clear picture of where emissions sit across the supply chain.

Why roadmaps without evidence fail scrutiny

Customers, investors and regulators increasingly want to see how a reduction claim was reached. A pathway built on industry averages is hard to defend when someone asks for the source.

Auditable carbon reduction services work the other way round. They record the data behind each input, show whether it was measured, calculated or estimated, and keep that trail intact as the plan evolves. If the evidence is thin, you know before anyone else does.

XYCLE decarbonisation evidence trail

How Minviro approaches decarbonisation strategy

Our approach moves from evidence to action in four steps.

  1. Baseline. We measure the footprint across scopes 1, 2 and 3 using a product-level LCA, following the GHG Protocol and ISO 14040/14044.

  2. Targets. We set reduction targets that match your ambition, including science-based targets where they apply.

  3. Pathways. We model the routes to get there, such as renewable power, recycled feedstock or an alternative supplier, and compare them side by side.

  4. Roadmap. We turn the preferred route into an execution plan with owners, milestones and reporting you can stand behind.

Baseline and pathway modelling run in XYCLE, so the numbers stay linked to their sources. Target-setting and the roadmap are consultant-led.
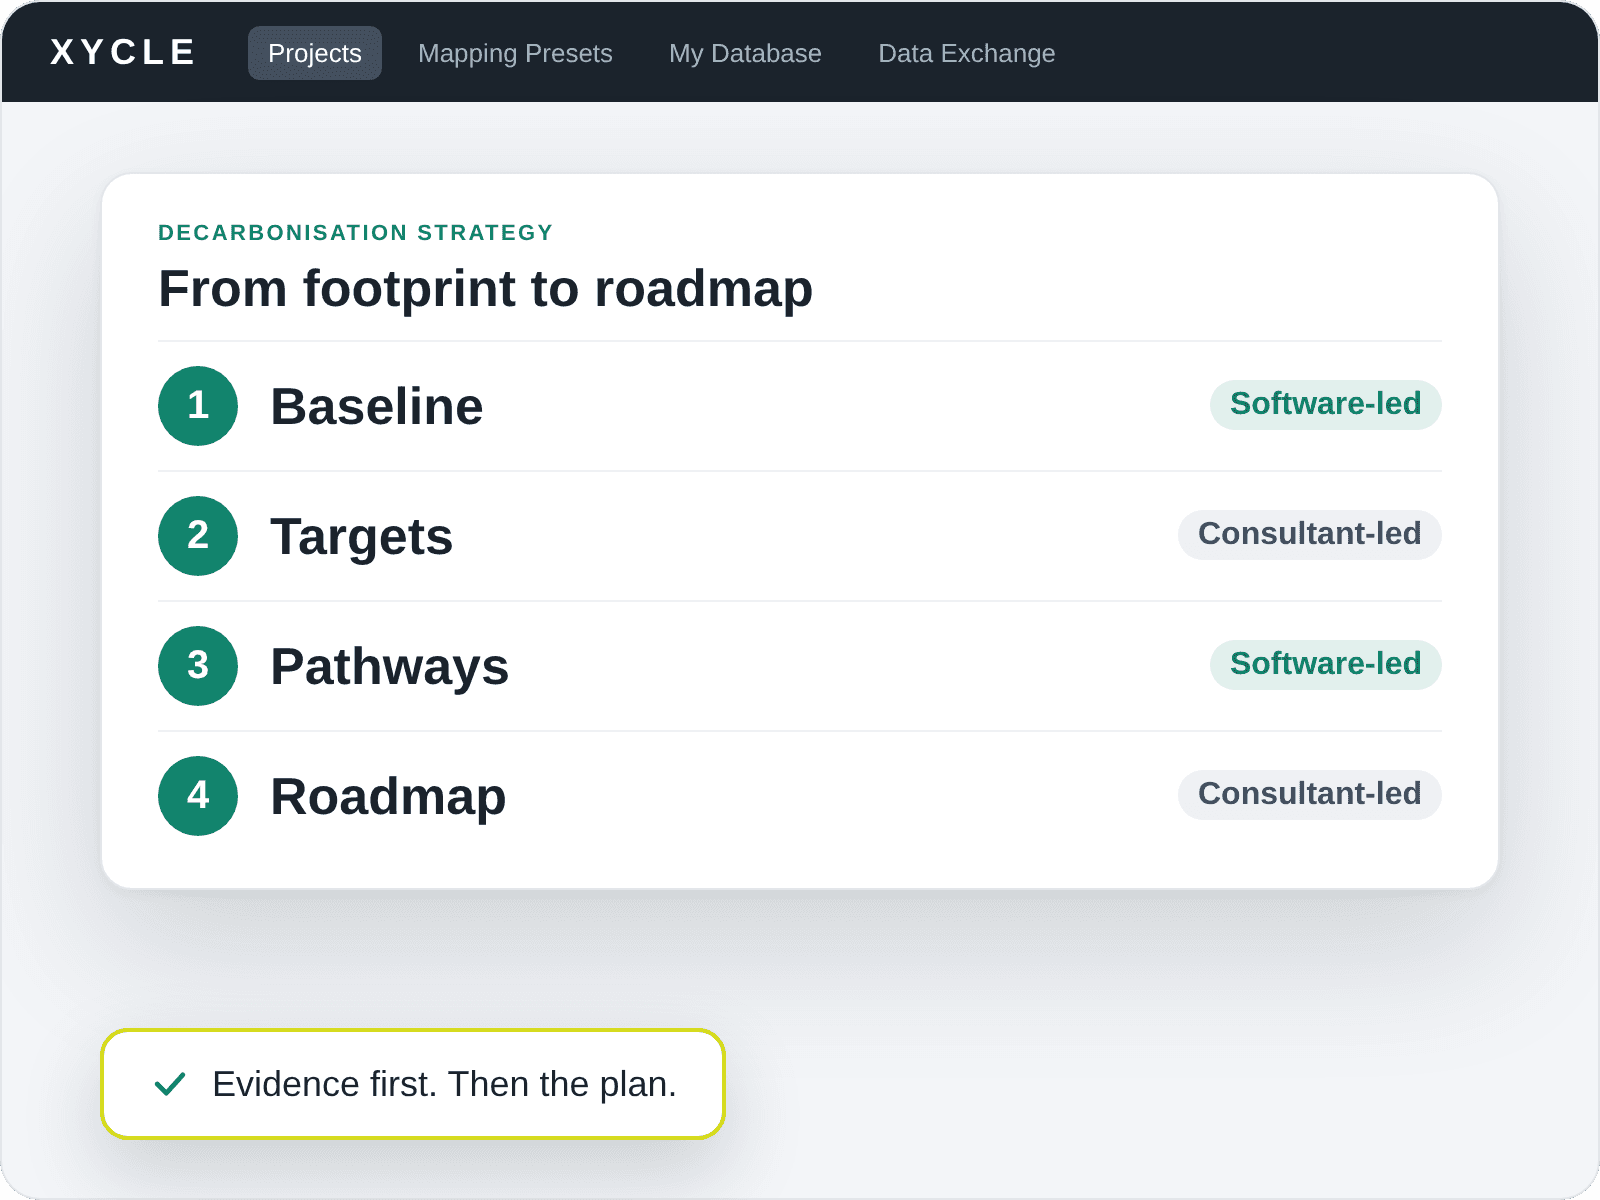
Four-step decarbonisation roadmap: baseline, targets, pathways and roadmap

Find the hotspot first

Most footprints are dominated by a few inputs. In the example below, electricity alone makes up about a quarter of the total, which makes it the obvious first lever. Once you can see that, you can compare a renewable power deal against recycled feedstock or a different supplier and choose on evidence.
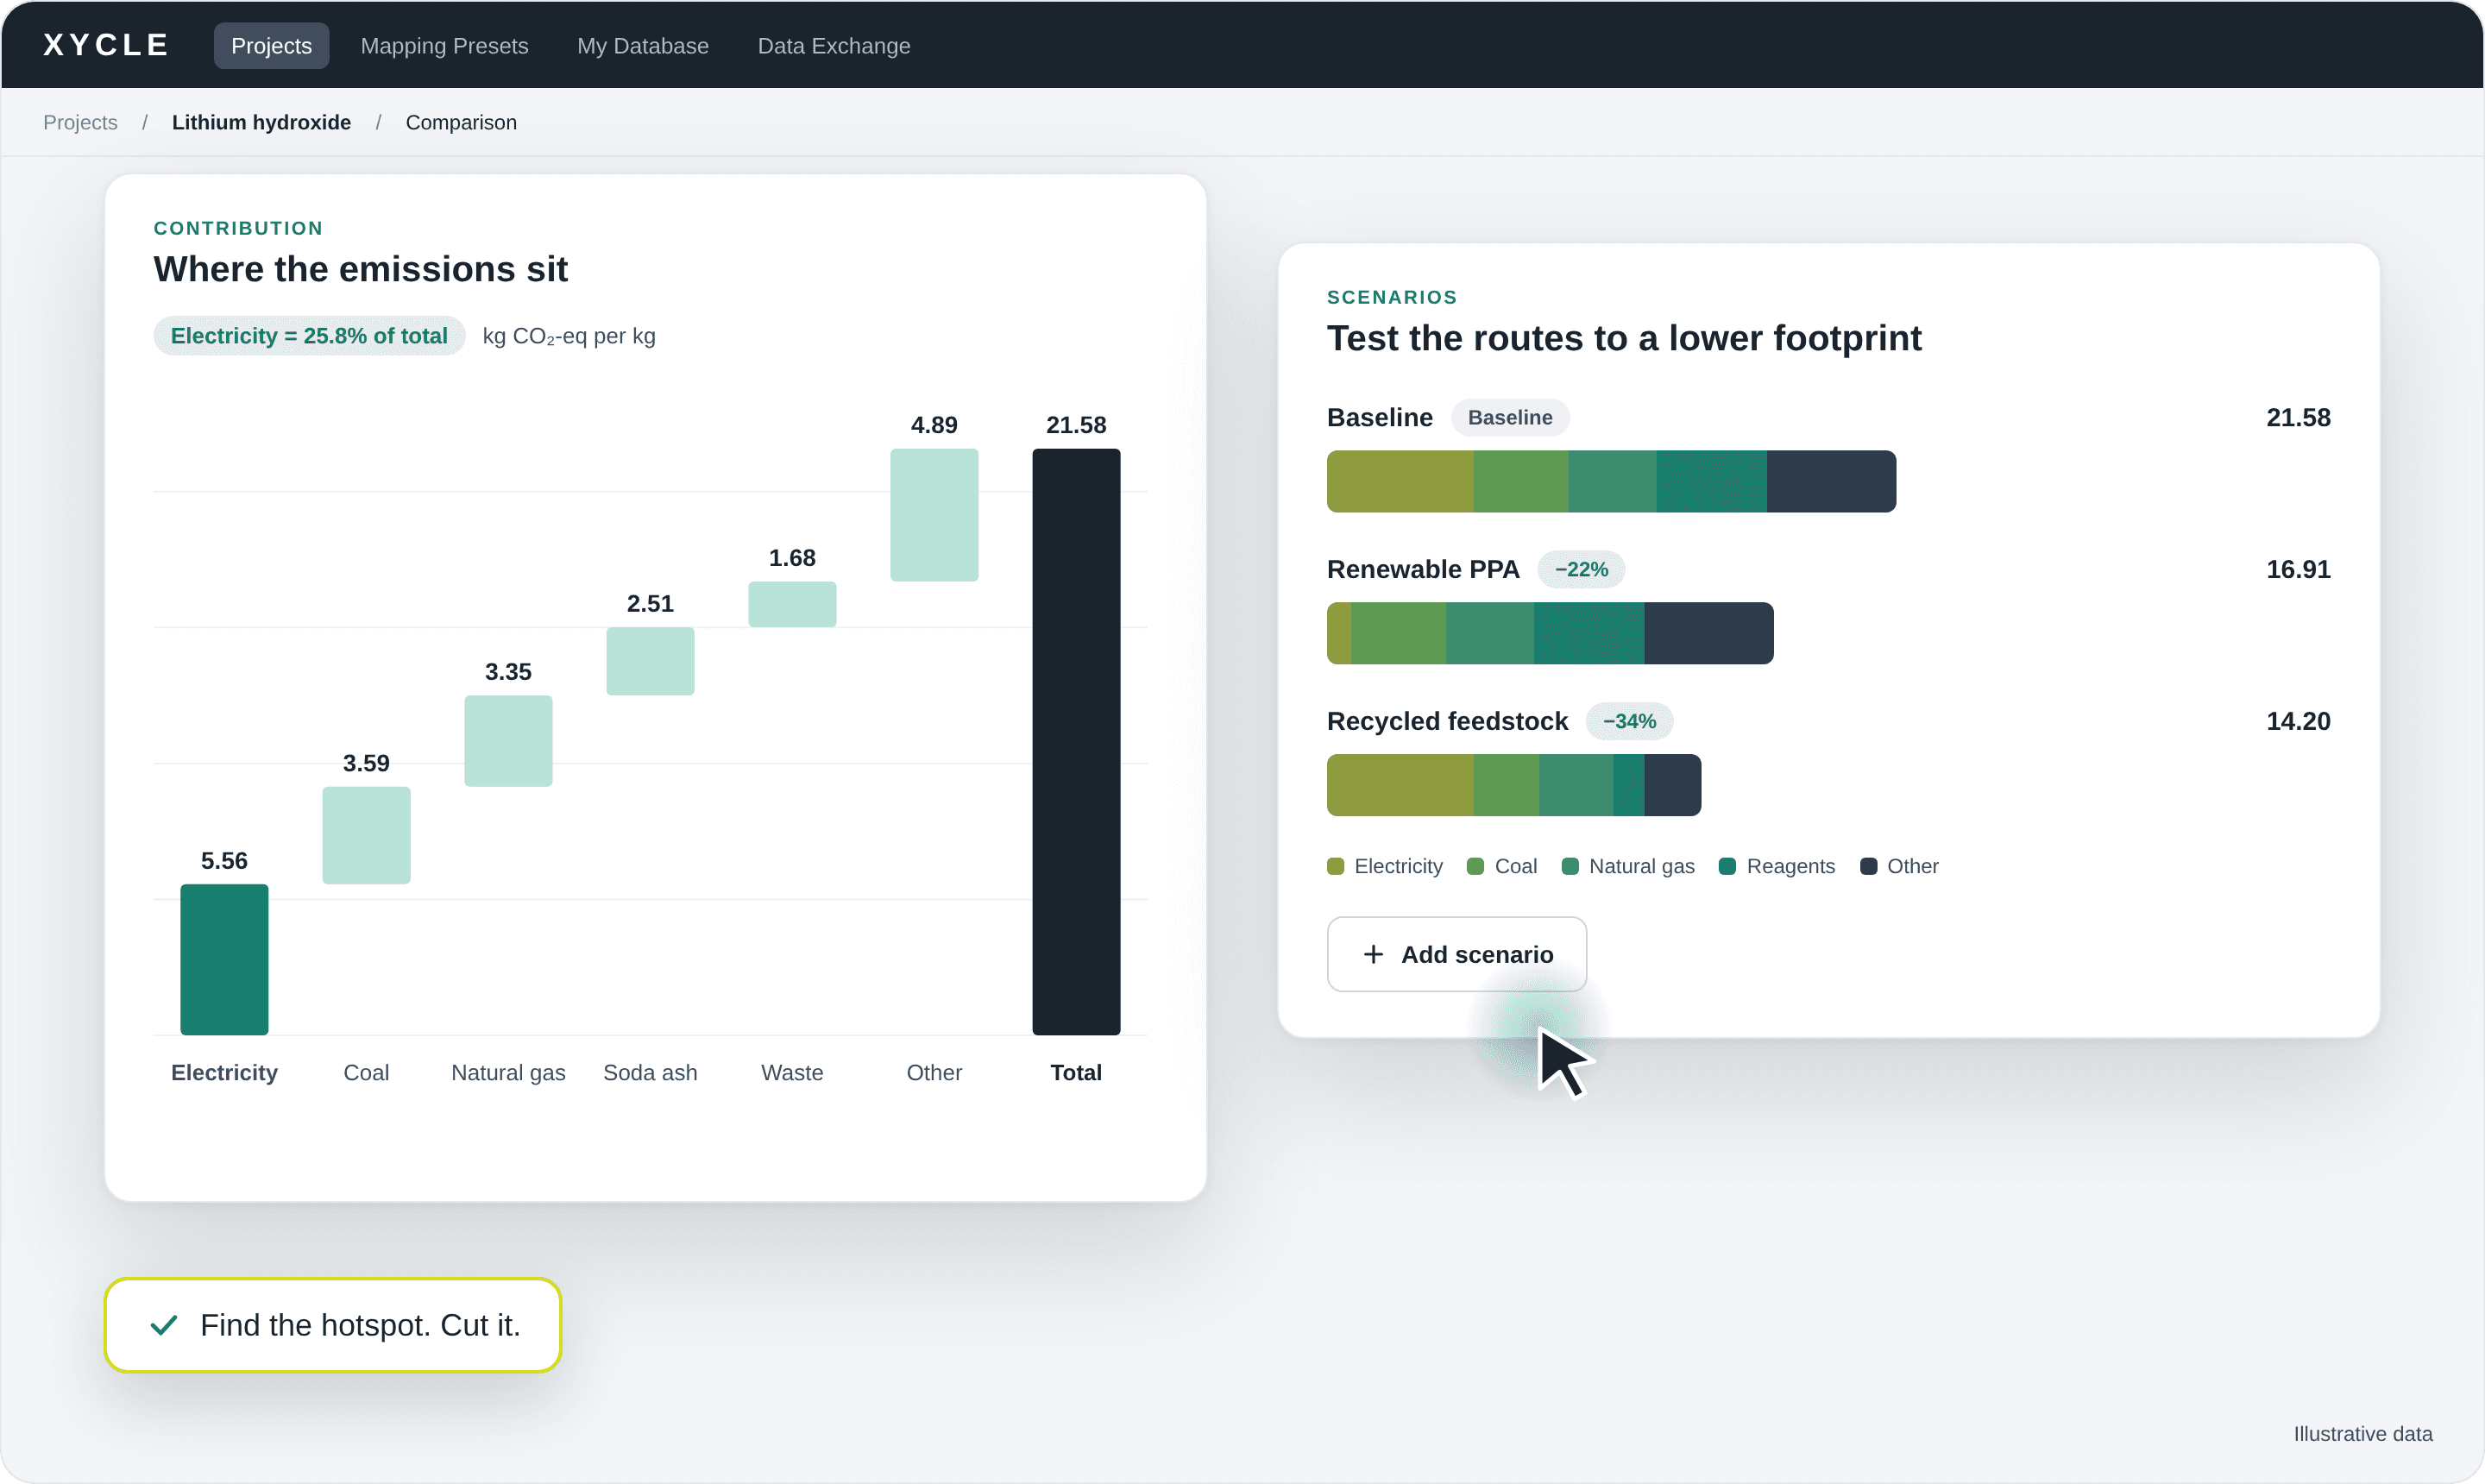
XYCLE hotspot analysis and reduction scenarios

Our approach moves from evidence to action in four steps.

  1. Baseline. We measure the footprint across scopes 1, 2 and 3 using a product-level LCA, following the GHG Protocol and ISO 14040/14044.

  2. Targets. We set reduction targets that match your ambition, including science-based targets where they apply.

  3. Pathways. We model the routes to get there, such as renewable power, recycled feedstock or an alternative supplier, and compare them side by side.

  4. Roadmap. We turn the preferred route into an execution plan with owners, milestones and reporting you can stand behind.

Baseline and pathway modelling run in XYCLE, so the numbers stay linked to their sources. Target-setting and the roadmap are consultant-led.

Four-step decarbonisation roadmap: baseline, targets, pathways and roadmap

Find the hotspot first

Most footprints are dominated by a few inputs. In the example below, electricity alone makes up about a quarter of the total, which makes it the obvious first lever. Once you can see that, you can compare a renewable power deal against recycled feedstock or a different supplier and choose on evidence.

XYCLE hotspot analysis and reduction scenarios

Case study: Vianode

Vianode, a Norwegian producer of synthetic anode graphite, asked Minviro to carry out a third-party LCA of its planned industrial-scale production. Anode graphite is the largest component of a lithium-ion battery by weight, so its footprint matters across the battery and EV value chain.

The study was a cradle-to-gate assessment covering scopes 1, 2 and 3, and it assessed climate change alongside water scarcity, land use, acidification, particulate matter, fossil resource use and mineral and metal resource use. It was carried out in line with ISO 14040 and ISO 14044.

The result: 1.9 kg CO₂e per kg of graphite produced. Vianode reports this as more than 90% lower than conventional production, using Benchmark Mineral Intelligence data for comparison. The LCA identified feedstock production and processing as the main emission contributors, and Vianode has set a 2030 goal of around 1 kg CO₂e per kg.

“Vianode’s synthetic anode graphite production offers a very low CO₂ footprint and the potential to contribute to significant emission reductions within the battery and EV value chain without compromising on product quality.”

Lydia Bridges, Senior Sustainability Consultant and Graphite Specialist, Minviro

This is what an evidence-led pathway looks like in practice. A verified baseline shows where the emissions come from, and that gives a target something credible to stand on.

Vianode, a Norwegian producer of synthetic anode graphite, asked Minviro to carry out a third-party LCA of its planned industrial-scale production. Anode graphite is the largest component of a lithium-ion battery by weight, so its footprint matters across the battery and EV value chain.

The study was a cradle-to-gate assessment covering scopes 1, 2 and 3, and it assessed climate change alongside water scarcity, land use, acidification, particulate matter, fossil resource use and mineral and metal resource use. It was carried out in line with ISO 14040 and ISO 14044.

The result: 1.9 kg CO₂e per kg of graphite produced. Vianode reports this as more than 90% lower than conventional production, using Benchmark Mineral Intelligence data for comparison. The LCA identified feedstock production and processing as the main emission contributors, and Vianode has set a 2030 goal of around 1 kg CO₂e per kg.

“Vianode’s synthetic anode graphite production offers a very low CO₂ footprint and the potential to contribute to significant emission reductions within the battery and EV value chain without compromising on product quality.”

Lydia Bridges, Senior Sustainability Consultant and Graphite Specialist, Minviro

This is what an evidence-led pathway looks like in practice. A verified baseline shows where the emissions come from, and that gives a target something credible to stand on.

Compliance-ready from the start

A strategy built on LCA data feeds directly into the reporting your customers and regulators ask for. That includes corporate disclosure under CSRD and ESRS, product-level requirements under the EU Battery Regulation, and embedded-emissions reporting under CBAM. Because the baseline is traceable, you can reuse it across these requirements rather than rebuilding it each time.

What to look for in a decarbonization strategy provider


Generic advisory

LCA-grounded strategy

Starting point

Company-level estimates

Product-level LCA

Data

Industry averages

Supplier and site-specific data where available

Hotspots

Often invisible

Identified and ranked

Pathways

Qualitative

Modelled and compared

Audit trail

Limited

Every input linked to a source

Frequently asked questions

Can the strategy support compliance reporting?

Yes. A traceable baseline can feed corporate disclosure, battery regulation and carbon border requirements, reducing duplicated effort.

How long does a decarbonisation strategy take?

The timeline depends on project scope.

Talk to the Minviro team

If you’re building a carbon reduction plan for an energy transition product, we can help you start from evidence.

Talk to an expert

A strategy built on LCA data feeds directly into the reporting your customers and regulators ask for. That includes corporate disclosure under CSRD and ESRS, product-level requirements under the EU Battery Regulation, and embedded-emissions reporting under CBAM. Because the baseline is traceable, you can reuse it across these requirements rather than rebuilding it each time.

What to look for in a decarbonization strategy provider


Generic advisory

LCA-grounded strategy

Starting point

Company-level estimates

Product-level LCA

Data

Industry averages

Supplier and site-specific data where available

Hotspots

Often invisible

Identified and ranked

Pathways

Qualitative

Modelled and compared

Audit trail

Limited

Every input linked to a source

Frequently asked questions

Can the strategy support compliance reporting?

Yes. A traceable baseline can feed corporate disclosure, battery regulation and carbon border requirements, reducing duplicated effort.

How long does a decarbonisation strategy take?

The timeline depends on project scope.

Talk to the Minviro team

If you’re building a carbon reduction plan for an energy transition product, we can help you start from evidence.

Talk to an expert

FAQ

Frequently asked questions

Let us support you on the journey.

Let us support you on the journey.

What do decarbonization strategy services include?

They typically cover an emissions baseline, target-setting, modelling of reduction pathways and a roadmap for delivery. At Minviro, the baseline and pathway modelling are built on LCA so each figure can be traced.

How is energy transition consulting different from general sustainability consulting?

Energy transition makers have a large share of emissions in materials and upstream processing. Specialist consulting pays attention to that supply chain, where general advice often stops at company-level reporting.

Do you need an LCA before setting reduction targets?

It isn’t mandatory, but it makes the targets far easier to defend. Without a product-level baseline, you risk targeting the wrong inputs or being unable to show how you reached the number.

What do decarbonization strategy services include?

They typically cover an emissions baseline, target-setting, modelling of reduction pathways and a roadmap for delivery. At Minviro, the baseline and pathway modelling are built on LCA so each figure can be traced.

How is energy transition consulting different from general sustainability consulting?

Energy transition makers have a large share of emissions in materials and upstream processing. Specialist consulting pays attention to that supply chain, where general advice often stops at company-level reporting.

Do you need an LCA before setting reduction targets?

It isn’t mandatory, but it makes the targets far easier to defend. Without a product-level baseline, you risk targeting the wrong inputs or being unable to show how you reached the number.

authors

The team behind your insights

Robert Pell

Robert Pell

Founder & CEO

Robert Pell is the Founder and CEO of Minviro. His doctoral research at the University of Exeter's Camborne School of Mines focused on responsible sourcing of rare earth elements, pioneering novel Life Cycle Assessment approaches and developing methodology for integrating LCA into mine planning. A published scientist and experienced speaker, Robert holds roles as Chair of the Rare Earth Industry Association (REIA) and the Critical Minerals Association (CMA).

Robert Pell

Robert Pell

Founder & CEO

Robert Pell is the Founder and CEO of Minviro. His doctoral research at the University of Exeter's Camborne School of Mines focused on responsible sourcing of rare earth elements, pioneering novel Life Cycle Assessment approaches and developing methodology for integrating LCA into mine planning. A published scientist and experienced speaker, Robert holds roles as Chair of the Rare Earth Industry Association (REIA) and the Critical Minerals Association (CMA).

LCA with Minviro

The foundation for
all our work

The foundation for all our work

Our data focuses on materials and processes where environmental performance varies sharply by route, geography, and technology, exactly where industry averages fall apart. Choose individual routes from across the critical minerals, battery, magnet, and heavy-industry value chains. Each one lands in XYCLE as a working model: open the unit processes, see where the impact sits, test a different supplier or energy grid, and watch the number move, defensible enough for a regulatory filing, transparent enough to act on.

read more

300+

projects across leading OEMs and product portfolios

46+

countries and regional data covered through our work

3

global offices in London, Perth and Shanghai