

Introduction
Run the same product model through two LCA tools and you can get two different carbon footprints. Neither tool is necessarily wrong. The gap usually comes from choices made out of sight: which database version sits underneath, how co-products share the burden, and how an impact method has been implemented.
For technology metals such as lithium, nickel, cobalt and rare earths, these choices matter more than for most products. Extraction routes vary by site, co-products are common, and upstream processing often dominates the footprint.
This article covers the eight most common causes of inconsistent results, what to check for each, and how to make your own results reproducible.
In short
Database versions and regional averages are the most common cause of different results.
Allocation and system boundary choices can move a metal’s footprint more than any data update.
The same inventory can give different results under different impact methods, or even different implementations of one method.
Results you can defend are results you can trace: every data source, version and method choice recorded.
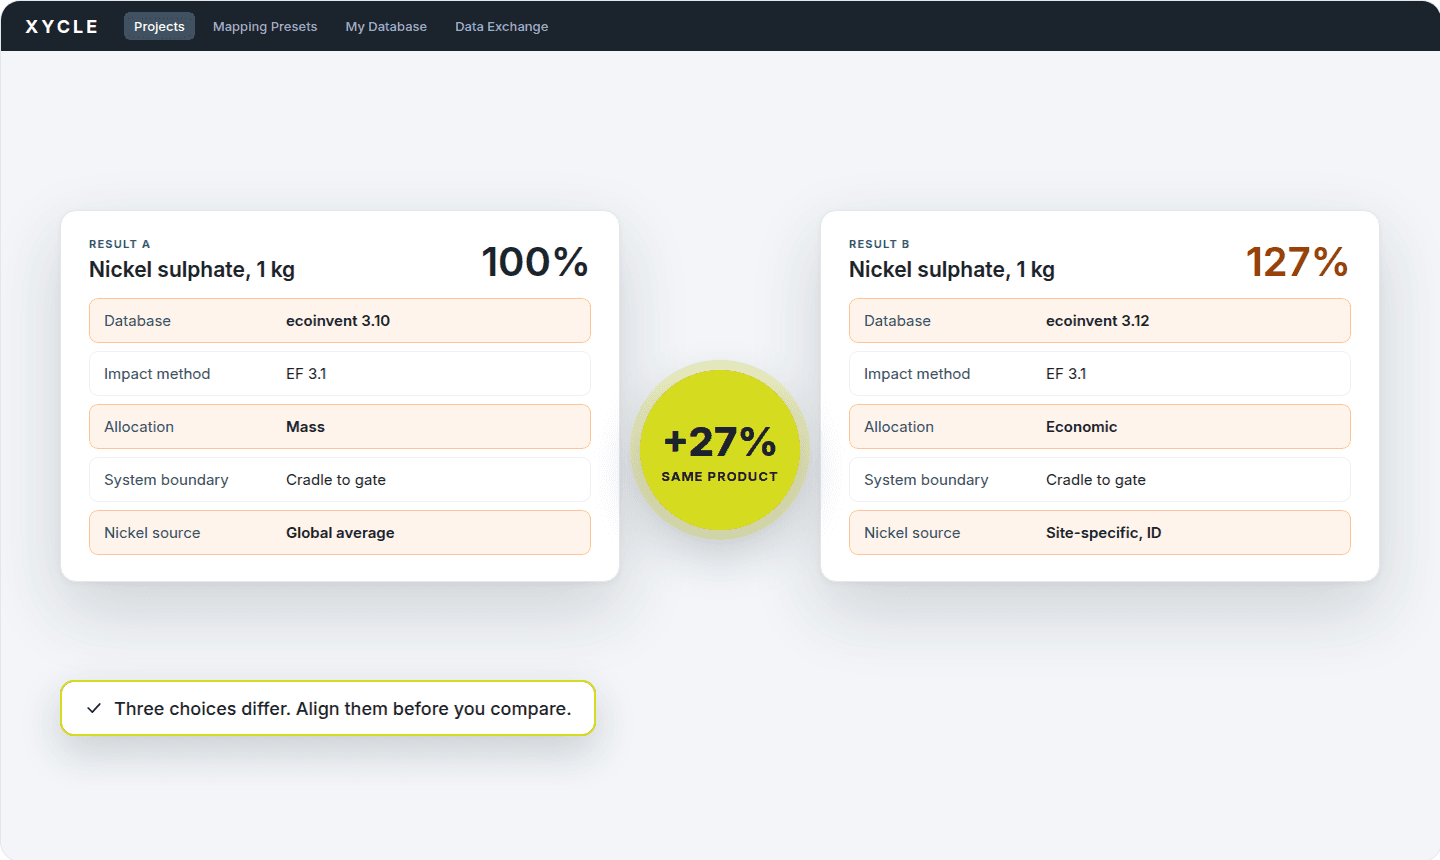
Illustrative: one product model gives different results when its underlying settings differ. Values are illustrative, not study results.
Eight reasons LCA software gives different results
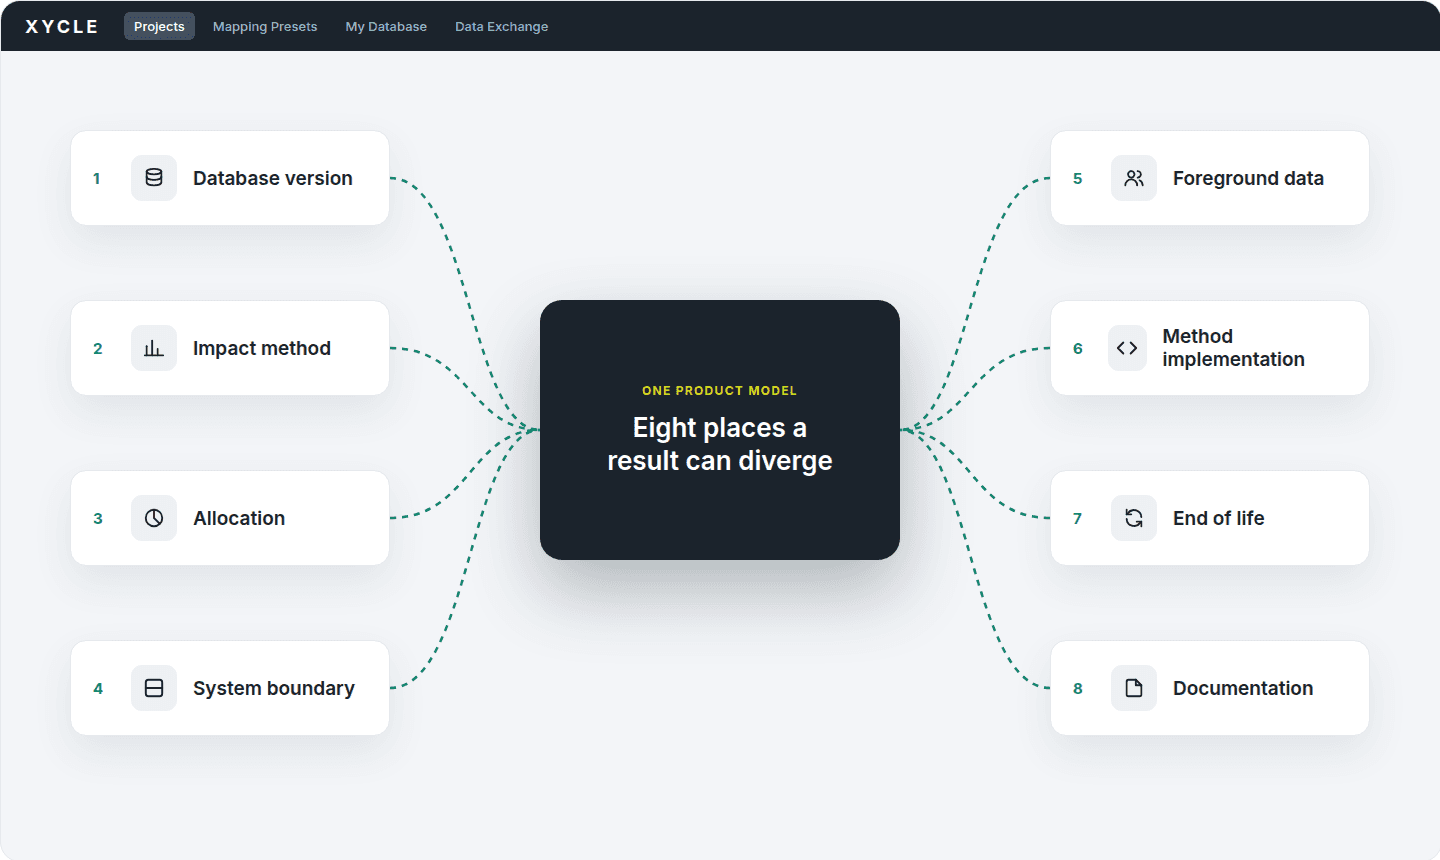
Illustrative: eight sources of variation that can change an LCA result.
1. Database version and regional averages
Every LCA tool runs on background datasets, and tools don’t all ship the same versions. A model built on ecoinvent 3.10 and the same model on 3.12 use different unit processes and electricity mixes, so they produce different results.
For metals the effect compounds. A global average cobalt dataset blends many countries and mines, so it can’t reflect the carbon intensity of the mine you actually buy from.
What to check: the database name, version and system model behind every result, and whether key materials use regional or site-specific data.
2. Impact assessment method
The same inventory gives different results under different life cycle impact assessment (LCIA) methods. EF 3.1, ReCiPe 2016 and TRACI apply their own characterisation factors, and each covers a different set of elementary flows. A flow counted in one method may be missing from another.
For metals this is most visible in toxicity and resource depletion, where factors can differ by orders of magnitude between methods.
What to check: that both results use the same method and version. Never switch methods mid-project or compare studies that used different ones.
3. Allocation for co-products
Mining and refining rarely make one product. Nickel laterite processing yields cobalt; lithium brine operations produce potash. Splitting the burden by mass, by economic value or by system expansion changes the footprint assigned to each product.
What to check: which allocation method was used, and whether you can see and change it.
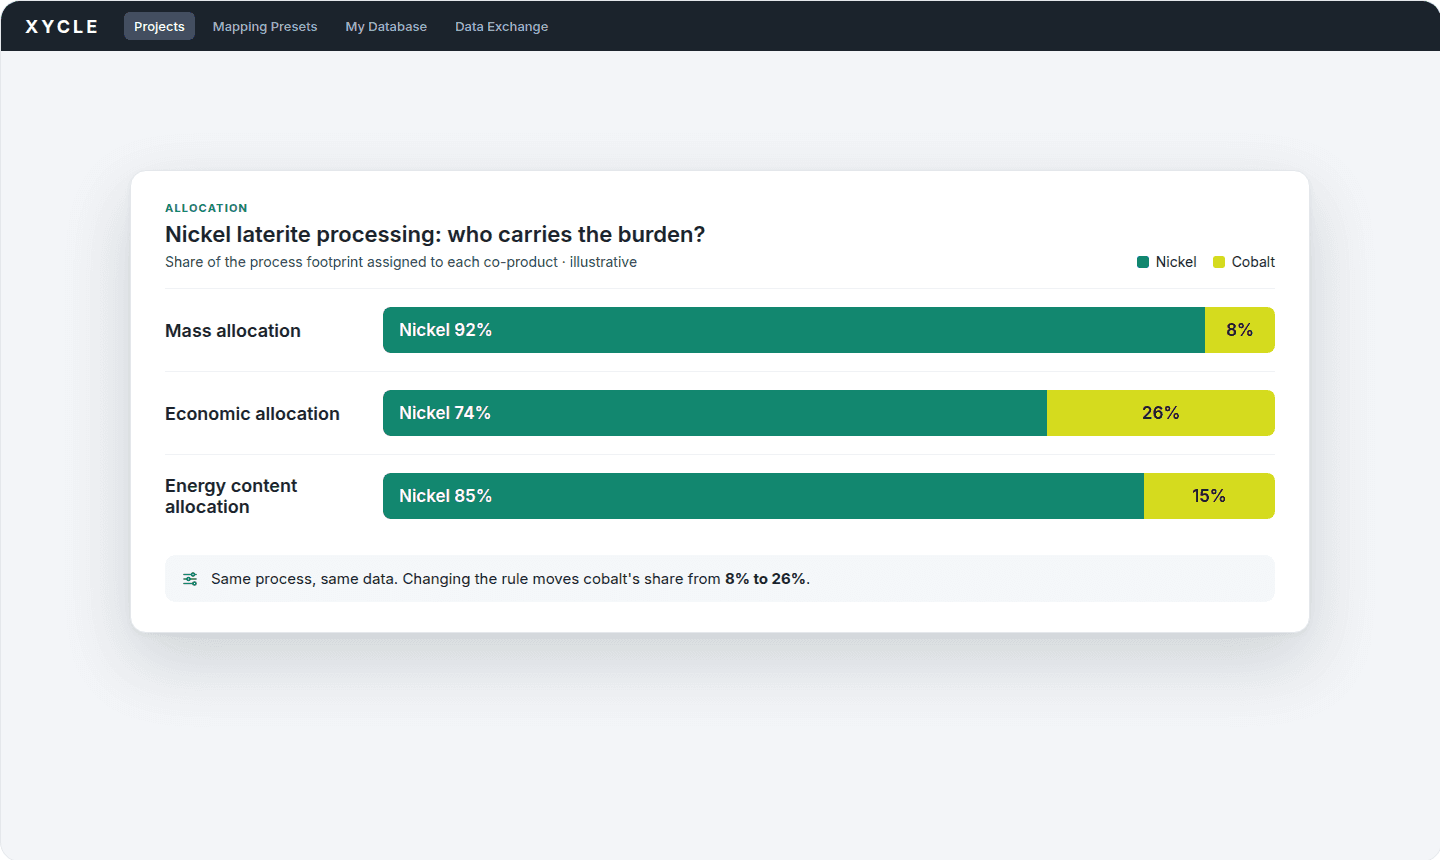
Illustrative: allocation choices change how the burden is shared between nickel and cobalt. Values are illustrative.
4. System boundary
Cradle-to-gate, gate-to-gate and cradle-to-grave include different steps. Two footprints for the same nickel sulphate can differ simply because one includes mining and the other starts at the refinery gate. For metals, upstream steps often dominate, so this choice has an outsized effect.
What to check: the boundary stated alongside every result, and the same boundary for any benchmark you compare against.
5. Foreground and supplier data
Foreground data is what you collect from your own sites or suppliers. Estimated energy use, assumed transport distances and missing process steps all add variation that no database can fix.
What to check: whether each input is measured, calculated or estimated, so you know where uncertainty sits and which data to improve first.
6. How a method is implemented
Two tools can implement the same LCIA method slightly differently. Flow mapping, unit conversions and rounding all introduce small differences. Across a product with dozens of inputs, such as a battery, these can add up to a visible gap.
What to check: that you can see how each inventory flow maps to its characterisation factor, and which method version the tool applies.
7. End-of-life and recycled content
The Circular Footprint Formula (CFF) in the EU’s Product Environmental Footprint framework uses parameters for recycled content, recyclability and energy recovery. Small changes, such as the quality ratio between virgin and recycled material, shift results significantly for metals with established recycling routes like copper and aluminium.
Metals with immature recycling, such as rare earths, add further modelling choices.
What to check: which end-of-life approach was used, and the parameter values behind it, not just the defaults.
8. Missing documentation
Many inconsistencies only appear when two practitioners compare results and find their assumptions differed. Without a record of every data source, allocation decision and boundary choice, finding the root cause takes days, and often fails.
What to check: that every assumption is recorded with the model, so anyone can reproduce the result.
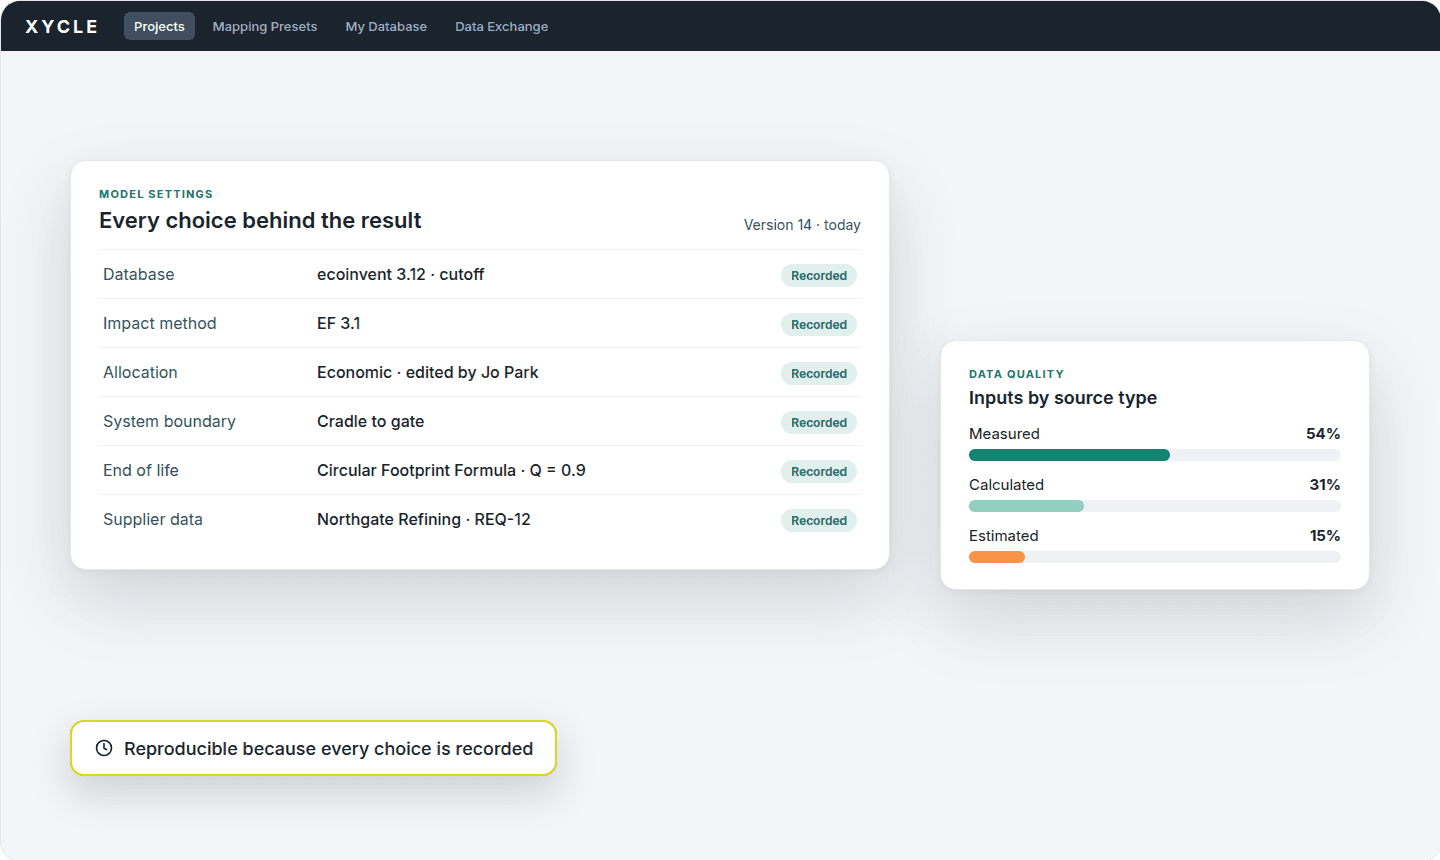
Illustrative: recording model settings and data provenance helps make results reproducible. Values are illustrative; this is a conceptual visual, not a confirmed feature screenshot.
Before you compare two results
If two footprints for the same product disagree, line these up first. Most gaps are explained by the first four.
Check | Result A | Result B |
|---|---|---|
Database and version | ||
Impact method and version | ||
Allocation method | ||
System boundary | ||
Functional unit | ||
Regional or site-specific data for key materials | ||
End-of-life approach and parameters | ||
Share of measured versus estimated foreground data |
If any row differs, the results aren’t comparable yet. Align that choice, rerun, and compare again.
What to look for in LCA software
Consistent results don’t come from one perfect tool. They come from tools that show their workings. When you evaluate LCA software, look for:
Visible versions. Database, system model and impact method versions shown on every result.
Editable choices. Allocation, boundaries and end-of-life parameters you can see and change, not hidden defaults.
Provenance per data point. Source and data quality recorded for each input, not just for the model as a whole.
Regional and site-specific data. For metals, data that reflects the route and region you actually source from.
An audit trail. Every change versioned, so a reviewer can follow the model without rebuilding it.
XYCLE brings LCA modelling and route-specific data together. Our route-specific data packages cover battery materials and rare earths, built from primary supplier data rather than industry averages. When evaluating the software, ask the team to demonstrate the data quality indicators and end-of-life parameter controls your study needs.
If you can’t fully trace or reproduce your current results, that’s the signal to review your tools and data. Explore XYCLE or browse our Data & Models. See how primary data is used in our case studies, or read about tackling data challenges in sustainable battery supply chains.